Author Archives: Chen Zhong

Improving Efficiency and Equity of Ambulance Services through Advanced Demand Modelling

Demand for Ambulance Services in England has risen dramatically over recent years, with growing pressure anticipated for future years. The disparity between the increasing demand and limited ambulance resources makes the major challenge for maintaining a high-quality service. In 2017, NHS England undertook a significant national reform called the Ambulance Response Programme (ARP), designed to address efficiency and performance issues. It noted the over-use of immediate dispatch decisions and the insufficient allocation of resources to incidents. Key issues concerned: the quality of care; its cost-effectiveness, and the equality of provision across areas and population groups. In view of the growing pressures of NHS, and the necessity of ambulance services to understand the needs of the populations they serve, the proposed PhD project aims to develop an advanced demand prediction model for ambulance services taking LAS as a case study.

The research is to find the best correlated socioeconomic, environmental, and spatiotemporal factors and to model these factors as predictors of ambulance demand.

The project is funded by the ESRC DTP and in collaboration with London Ambulance Service. The PhD student working on this project is Samuel Murphy.

open positions

We are recruiting a Research Fellow and a 3 years PhD both around the theme of Urban Mobility analysis and modelling at the Centre for Advanced Spatial Analysis, University College London. The candidates are expected to have high motivation for research and enjoy working in an international and cross-disciplinary team.

The Research Fellow position is intended for full-time work. Research should start asap in June/July 2020. The closing date is 12 May 2021.

Link to the full job post: 

https://www.jobs.ac.uk/job/CFN347/research-fellow-in-urban-mobility

The funded PhD position is expected to start this fall. It is open to UK/EU and international students and supported at the same level. That means international students might need other financial sources to match up the cost. The application deadline is 31 May 2021.

Link to the full job post: 

https://www.jobs.ac.uk/job/CFM750/full-time-phd-in-urban-mobility-ref1876095

I would very much appreciate it if you could share this with potential candidates, or, please contact me for any questions and make formal application if you are the one.

SIMETRI: SustaInable Mobility and Equality in mega-ciTy RegIons: patterns, mechanisms and governance

SIMETRI is funded by the NSFC JPI Urban Europe programme, running from May 2019 – 2022.

SIMETRI brings together researchers from University College London, Birkbeck University of London, King’s College London, Vrije Universiteit Amsterdam, Shenzhen University, Shenzhen Institute of Research and Innovation, The University of Hong Kong, and Sun Yat-sen University. It is to develop a world-class science platform relevant to political decision-makers responsible for housing, transport, employment and urban development in the world’s biggest mega-city region, the Pearl River Delta Greater Bay Area. The platform integrates work on inequality indicators and predicting future land use and transport developed in western Europe in London and the Randstad with related work in Shenzhen and Guangzhou, producing a system that will use state-of-the-art simulation models, big data from routine transport, and new ways of using information technology for participatory governance. 

The UK team (UCL-BBK-KCL) is leading Work Package 3 – Indicators for sustainable mega-city region development, which has four research tasks:

T3.1. Indicators of spatio-social segregation
T3.2. Indicators for measuring mobility and relocation patterns
T3.3. Indicators for measuring social inequality
T3.4. Comparative analysis of inequality on 3 mega-city regions

Link to the project website: https://simetri.uk/about-the-project

Link to the proposal: http://www.spatialcomplexity.info/files/2019/01/NSFC-JPI-UE-Joint-Call-Proposal-SIMETRI.pdf

Currently, we have Bowen Zhang working on a dissertation titled “Modelling Urban Clusters in Mega-city Region based on Human Mobility Pattern” and Dr. Qili Gao who joined us recently as a Research Fellow. Her work focus on spatial-temporal data mining, urban informatics, and analysis on human mobility and activity behaviours for urban and transport planning. Each year, we have several CASA MSc students joining us for a short dissertation project over the summer.

Zipf, Power-laws, and Pareto

this is a repost from

Zipf, Power-laws, and Pareto – a ranking tutorial

Thanks to the author,

Lada A. Adamic

Information Dynamics Lab
Information Dynamics Lab, HP Labs
Palo Alto, CA 94304

it is a very clear brief introduction. I copied and pasted it here for my self -study. all credits belong to the author Lada A. Adamic. thanks again.

btw, the fantastic cover image is downloaded from here in case you want a wall paper.

Abstract
Many man made and naturally occurring phenomena, including city sizes, incomes, word frequencies, and earthquake magnitudes, are distributed according to a power-law distribution. A power-law implies that small occurrences are extremely common, whereas large instances are extremely rare. This regularity or ‘law’ is sometimes also referred to as Zipf and sometimes Pareto. To add to the confusion, the laws alternately refer to ranked and unranked distributions. Here we show that all three terms, Zipf, power-law, and Pareto, can refer to the same thing, and how to easily move from the ranked to the unranked distributions and relate their exponents.

A line appears on a log-log plot. One hears shouts of “Zipf!”,”power-law!”,”Pareto”! Well, which one is it? The answer is that it’s quite possibly all three. Let’s try to disentangle some of the confusion surrounding these matters and then tie it all back neatly together.

All three terms are used to describe phenomena where large events are rare, but small ones quite common. For example, there are few large earthquakes but many small ones. There are a few mega-cities, but many small towns. There are few words, such as ‘and’ and ‘the’ that occur very frequently, but many which occur rarely.

Zipf’s law usually refers to the ‘size’ y of an occurrence of an event relative to it’s rank r. George Kingsley Zipf, a Harvard linguistics professor, sought to determine the ‘size’ of the 3rd or 8th or 100th most common word. Size here denotes the frequency of use of the word in English text, and not the length of the word itself. Zipf’s law states that the size of the r’th largest occurrence of the event is inversely proportional to it’s rank:
y ~ r-b, with b close to unity.

Pareto was interested in the distribution of income. Instead of asking what the th largest income is, he asked how many people have an income greater than x. Pareto’s law is given in terms of the cumulative distribution function (CDF), i.e. the number of events larger than x is an inverse power of x:
P[X > x] ~ x-k.
It states that there are a few multi-billionaires, but most people make only a modest income.

What is usually called a power law distribution tells us not how many people had an income greater than x, but the number of people whose income is exactly x. It is simply the probability distribution function (PDF) associated with the CDF given by Pareto’s Law. This means that
P[X = x] ~ x-(k+1) = x-a.
That is the exponent of the power law distribution a = 1+k (where k is the Pareto distribution shape parameter).
See Appendix 1 for discussion of Pareto and power-law.

Although the literature surrounding both the Zipf and Pareto distributions is vast, there are very few direct connections made between Zipf and Pareto, and when they exist, it is by way of a vague reference [1] or an overly complicated mathematical analysis[2,3]. Here I show a simple and direct relationship between the two by walking through an example using real data.

Recently, attention has turned to the internet which seems to display quite a number of power-law distributions: the number of visits to a site [4], the number of pages within a site [5], and the number of links to a page [6], to name a few. My example will be the distribution of visits to web sites.

Figure 1a below shows the distribution of AOL users’ visits to various sites on a December day in 1997. One can observe that a few sites get upward of 2000 visitors, whereas most sites got only a few visits (70,000 sites received only a single visit). The distribution is so extreme that if the full range was shown on the axes, the curve would be a perfect L shape. Figure 1b below shows the same plot, but on a log-log scale the same distribution shows itself to be linear. This is the characteristic signature of a power-law.

distribution of AOL users among sites - linear plot histogram of the number of AOL users visiting each site
Fig. 1a Linear scale plot of the distribution of users among web sites Fig. 1b Log-log scale plot of the distribution of users among web sites

Let y = number of sites that were visited by x users.
In a power-law we have y = C x-a which means that log(y) = log(C) – a log(x)
So a power-law with exponent a is seen as a straight line with slope -a on a log-log plot.

Now one just might be tempted to fit the curve in Fig. 1b to a line to extract the exponent a. A word of caution is in order here. The tail end of the distribution in Fig. 1b is ‘messy’ – there are only a few sites with a large number of visitors. For example, the most popular site, Yahoo.com, had 129,641 visitors, but the next most popular site had only 25,528. Because there are so few data points in that range, simply fitting a straight line to the data in Fig. 1b gives a slope that is too shallow (a = 1.17). To get a proper fit, we need to bin the data into exponentially wider bins (they will appear evenly spaced on a log scale) as shown in Fig. 2a. A clean linear relationship now extends over 4 decades (1-104) users vs. the earlier 2 decades: (1-100) users. We are now able to extract the correct exponent a = 2.07. Rather than binning logarithmically, one can instead look at the Pareto cumulative distribution P[X > x] ~ x-k to obtain a good fit. The tail naturally smooths out in the cumulative distribution and no data is ‘obscured’ as in the logarithmic binning procedure. Fitting the cumulative distribution, we find an exponent of a = 2.16, quite close to the a=2.07 exponent found with the logarithmic binning procedure (both fits are shown in Figure 2b).

binned histogram of number of AOL users visiting each site cumulative histogram of number of AOL users visiting each site
Fig. 2a Binned distribution of users to sites Fig. 2b Cumulative distribution of users to sites

So far we have only looked at the power-law PDF of sites visits. In order to see Zipf’s law, we need to plot the number of visitors to each site against its rank. Fig. 3 shows such a plot for the same data set of AOL users’ site visits. The relationship is nearly linear on a log-log plot, and the slope is -1, which makes it Zipf. In order for there to be perfectly linear relationship, the most popular sites would have to be slightly popular, and the less popular sites slightly more numerous. It might be worthwhile to fit this distribution with alternate distributions, such as the stretched exponential [7], or parabolic fractal [8]. In any case, most would happy to call this rank distribution Zipf, and we will call it Zipf here as well.

ranked plot of the number of AOL users visiting each site
Fig. 3 Sites rank ordered by their popularity

At first, it appears that we have discovered two separate power laws, one produced by ranking the variables, the other by looking at the frequency distribution. Some papers even make the mistake of saying so [9]. But the key is to formulate the rank distribution in the proper way to see its direct relationship to the Pareto. The phrase “The r th largest city has n inhabitants” is equivalent to saying “r cities have n or more inhabitants”. This is exactly the definition of the Pareto distribution, except the x and y axes are flipped. Whereas for Zipf, r is on the x-axis and n is on the y-axis, for Pareto, r is on the y-axis and n is on the x-axis. Simply inverting the axes, we get that if the rank exponent is b, i.e.
n ~ r-b in Zipf,   (n = income, r = rank of person with income n)
then the Pareto exponent is 1/b so that
r ~ n-1/b   (n = income, r = number of people whose income is n or higher)
(See Appendix 2 for details).

Of course, since the power-law distribution is a direct derivative of Pareto’s Law, its exponent is given by (1+1/b). This also implies that any process generating an exact Zipf rank distribution must have a strictly power-law probability density function. As demonstrated with the AOL data, in the case b = 1, the power-law exponent a = 2.

Finally, instead of touting two separate power-laws, we have confirmed that they are different ways of looking at the same thing.

Acknowledgements

The author would like to thank Bernardo Huberman, Rajan Lukose, and Eytan Adar for their advice and comments.

References

1. Per Bak, “How Nature Works: The science of self-organized criticality”, Springer-Verlag, New York, 1996.

2. G. Troll and P. beim Graben (1998), “Zipf’s law is not a consequence of the central limit theorem”, Phys. Rev. E, 57(2):1347-1355.

3. R. Gunther, L. Levitin, B. Shapiro, P. Wagner (1996), “Zipf’s law and the effect of ranking on probability distributions”, International Journal of Theoretical Physics, 35(2):395-417

4. L.A. Adamic and B.A. Huberman (2000), “The Nature of Markets in the World Wide Web”, QJEC 1(1):5-12.

5. B.A. Huberman and L.A. Adamic (1999), “Growth Dynamics of the World Wide Web”, Nature 401:131.

6. R. Albert, H. Jeoung, A-L Barabasi, “The Diameter of the World Wide Web”, Nature 401:130.

7. Jean Laherrere, D Sornette (1998), “Stretched exponential distributions in Nature and Economy: ‘Fat tails’ with characteristic scales”, European Physical Journals, B2:525-539. http://xxx.lanl.gov/abs/cond-mat/9801293

8. Jean Laherrere (1996), “‘Parabolic fractal’ distributions in Nature”.

9. M. Faloutsos, P. Faloutsos, and C. Faloutsos, “On Power-Law Relationships of the Internet Topology”, SIGCOMM ’99 pp. 251-262.

10. N. Johnson, S. Kotz, N. Balakrishnan, “Continuous Univariate Distributions Vol. 1”, Wiley, New York, 1994.


Appendix 1: The Pareto Distribution

The Pareto distribution gives the probability that a person’s income is greater than or equal to x and is expressed as [10]:

Pr[X >= x] = (m/x)k,     m > 0, k > 0, x >= m,

where m represents a minimum income.
As a consequence, the CDF

Pr[X < x] = 1 – (m/x)k

and the PDF is

pX(x) = k mkx-(k+1),      m > 0, k > 0, x >= m

Note that the shape parameter of the Pareto distribution, k, equals a-1, where a is the power law slope. Also note that for a < 2 there is no finite mean for the distribution. Presumably because of this, the Pareto distribution is sometimes given with k > 1, but the k > 0 definition is more widely used.

Another property, which holds for all k, not just those k not giving a finite mean, is that the distribution is said to be “scale-free”, or lacking a “characteristic length scale”. This means that no matter what range of x one looks at, the proportion of small to large events is the same, i.e., the slope of the curve on any section of the log-log plot is the same.

Appendix 2: From Zipf’s ranked distribution to powerlaw PDFs

Let the slope of the ranked plot be b.

Then the expected value E[Xr ] of the rth ranked variable Xr is given by

E[Xr ] ~ C1*r-b,     C1 a normalization constant,

which means that there are r variables with expected value greater than or equal to C1*r-b:

P[X >= C1*r-b] = C2*r

Changing variables we get:

P[X >= y] ~ y-(1/b)

To get the PDF from the CDF, we take the derivative with respect to y:

Pr[X == y] ~ y-(1+(1/b)) = y-a.

Which gives the desired correspondence between the two exponents.

a = 1+(1/b)


Developing an Accessibility Box

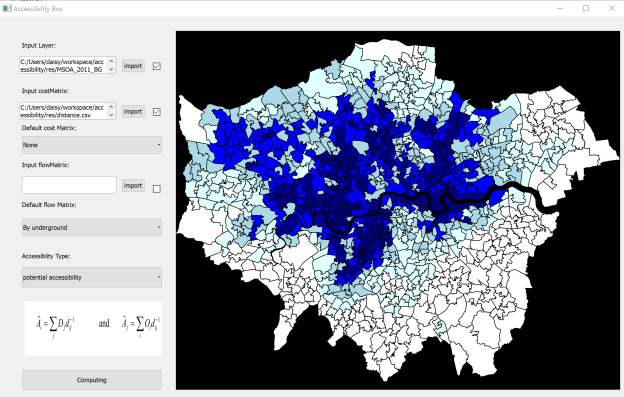
Can’t say it is really fun, but good to gain an overview of Accessibility measure in such way. The draft version of the accessibility measure box is Done!!!! yeah!!!!

Everything written in Python, and will be published as open source tool. or a Qgis Plugin in. 12+ accessibility measure(very simple ones) added in according the notes given by my advisor. I will add more “modern ones” from my own exploration after finishing those “classic ones”. So continuing developing. ….

Don’t really like Python, still. Maybe I was in Java for too long time. But I have to say… it is continent, even though I am quite sure about why.

Look! I haven’t really double check the calculations, but the results seem all right. first on is accessibility by car, and second picture is accessibility by foot, the cover page is by underground. (sort of make sense) Dark blue means higher accessibility while lighter means lower. 

Capture3_carCapture2_foot

Variability in Regularity – call for partners

Paper is online now –>

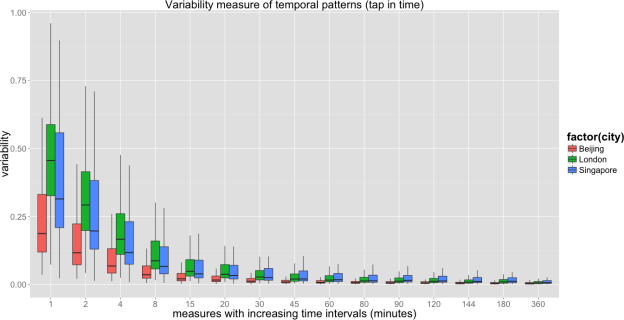
Variability in Regularity: Mining Temporal Mobility Patterns in London, Singapore and Beijing Using Smart-Card Data

It was fast process. 1.5 month in review and 0.5 month revision and then online. The motivation to publish on Plosone is just that simple- because all my colleagues have at least one. So I did it. (Sounds a bit silly)

But another serious reason, is that, I want to advertise this work as soon as possible, and get more collaborators to join us. I like the title of this paper quite a lot – “variability in regularity” and if you read through the paper, you will find a sort of “regularity in variability” we found. isn’t it beautiful the type of “paradox”… in patterns and universal laws.

I am happy with the publication, though I am not quite happy with the result we got there, which is rather tentative than comprehensive. There is a rough plan in my mind to further develop this comparative idea:

characterizing cities from mobility patterns

then

explaining the variability from urban context

then

urban scenarios towards improving urban mobility and related.

let me know if you want to join us….

转帖:主成分分析PCA的数学原理

还是很佩服有的作者就可以深入浅出的讲清楚一个问题,讲述的风格应该学习学习。原帖在这里:

http://dataunion.org/13702.html

这wordpress也不能直接引其他的博客,贴过来好了。当时留个记录自己也学习学习。

=============================================================================================

PCA(Principal Component Analysis)是一种常用的数据分析方法。PCA通过线性变换将原始数据变换为一组各维度线性无关的表示,可用于提取数据的主要特征分量,常用于高维数据的降维。网上关于PCA的文章有很多,但是大多数只描述了PCA的分析过程,而没有讲述其中的原理。这篇文章的目的是介绍PCA的基本数学原理,帮助读者了解PCA的工作机制是什么。

当然我并不打算把文章写成纯数学文章,而是希望用直观和易懂的方式叙述PCA的数学原理,所以整个文章不会引入严格的数学推导。希望读者在看完这篇文章后能更好的明白PCA的工作原理。

数据的向量表示及降维问题

一般情况下,在数据挖掘和机器学习中,数据被表示为向量。例如某个淘宝店2012年全年的流量及交易情况可以看成一组记录的集合,其中每一天的数据是一条记录,格式如下:

(日期, 浏览量, 访客数, 下单数, 成交数, 成交金额)

其中“日期”是一个记录标志而非度量值,而数据挖掘关心的大多是度量值,因此如果我们忽略日期这个字段后,我们得到一组记录,每条记录可以被表示为一个五维向量,其中一条看起来大约是这个样子:

(500,240,25,13,2312.15)T

注意这里我用了转置,因为习惯上使用列向量表示一条记录(后面会看到原因),本文后面也会遵循这个准则。不过为了方便有时我会省略转置符号,但我们说到向量默认都是指列向量。

我们当然可以对这一组五维向量进行分析和挖掘,不过我们知道,很多机器学习算法的复杂度和数据的维数有着密切关系,甚至与维数呈指数级关联。当然,这里区区五维的数据,也许还无所谓,但是实际机器学习中处理成千上万甚至几十万维的情况也并不罕见,在这种情况下,机器学习的资源消耗是不可接受的,因此我们必须对数据进行降维。

降维当然意味着信息的丢失,不过鉴于实际数据本身常常存在的相关性,我们可以想办法在降维的同时将信息的损失尽量降低。

举个例子,假如某学籍数据有两列M和F,其中M列的取值是如何此学生为男性取值1,为女性取值0;而F列是学生为女性取值1,男性取值0。此时如果我们统计全部学籍数据,会发现对于任何一条记录来说,当M为1时F必定为0,反之当M为0时F必定为1。在这种情况下,我们将M或F去掉实际上没有任何信息的损失,因为只要保留一列就可以完全还原另一列。

当然上面是一个极端的情况,在现实中也许不会出现,不过类似的情况还是很常见的。例如上面淘宝店铺的数据,从经验我们可以知道,“浏览量”和“访客数”往往具有较强的相关关系,而“下单数”和“成交数”也具有较强的相关关系。这里我们非正式的使用“相关关系”这个词,可以直观理解为“当某一天这个店铺的浏览量较高(或较低)时,我们应该很大程度上认为这天的访客数也较高(或较低)”。后面的章节中我们会给出相关性的严格数学定义。

这种情况表明,如果我们删除浏览量或访客数其中一个指标,我们应该期待并不会丢失太多信息。因此我们可以删除一个,以降低机器学习算法的复杂度。

上面给出的是降维的朴素思想描述,可以有助于直观理解降维的动机和可行性,但并不具有操作指导意义。例如,我们到底删除哪一列损失的信息才最小?亦或根本不是单纯删除几列,而是通过某些变换将原始数据变为更少的列但又使得丢失的信息最小?到底如何度量丢失信息的多少?如何根据原始数据决定具体的降维操作步骤?

要回答上面的问题,就要对降维问题进行数学化和形式化的讨论。而PCA是一种具有严格数学基础并且已被广泛采用的降维方法。下面我不会直接描述PCA,而是通过逐步分析问题,让我们一起重新“发明”一遍PCA。

向量的表示及基变换

既然我们面对的数据被抽象为一组向量,那么下面有必要研究一些向量的数学性质。而这些数学性质将成为后续导出PCA的理论基础。

内积与投影

下面先来看一个高中就学过的向量运算:内积。两个维数相同的向量的内积被定义为:

QQ截图20150402160700

内积运算将两个向量映射为一个实数。其计算方式非常容易理解,但是其意义并不明显。下面我们分析内积的几何意义。假设A和B是两个n维向量,我们知道n维向量可以等价表示为n维空间中的一条从原点发射的有向线段,为了简单起见我们假设A和B均为二维向量,则A=(x1,y1)B=(x2,y2)。则在二维平面上A和B可以用两条发自原点的有向线段表示,见下图:

好,现在我们从A点向B所在直线引一条垂线。我们知道垂线与B的交点叫做A在B上的投影,再设A与B的夹角是a,则投影的矢量长度为|A|cos(a),其中QQ截图20150402160744是向量A的模,也就是A线段的标量长度。

注意这里我们专门区分了矢量长度和标量长度,标量长度总是大于等于0,值就是线段的长度;而矢量长度可能为负,其绝对值是线段长度,而符号取决于其方向与标准方向相同或相反。

到这里还是看不出内积和这东西有什么关系,不过如果我们将内积表示为另一种我们熟悉的形式:

AB=|A||B|cos(a)

现在事情似乎是有点眉目了:A与B的内积等于A到B的投影长度乘以B的模。再进一步,如果我们假设B的模为1,即让|B|=1,那么就变成了:

AB=|A|cos(a)

也就是说,设向量B的模为1,则A与B的内积值等于A向B所在直线投影的矢量长度!这就是内积的一种几何解释,也是我们得到的第一个重要结论。在后面的推导中,将反复使用这个结论。

下面我们继续在二维空间内讨论向量。上文说过,一个二维向量可以对应二维笛卡尔直角坐标系中从原点出发的一个有向线段。例如下面这个向量:

在代数表示方面,我们经常用线段终点的点坐标表示向量,例如上面的向量可以表示为(3,2),这是我们再熟悉不过的向量表示。

不过我们常常忽略,只有一个(3,2)本身是不能够精确表示一个向量的。我们仔细看一下,这里的3实际表示的是向量在x轴上的投影值是3,在y轴上的投影值是2。也就是说我们其实隐式引入了一个定义:以x轴和y轴上正方向长度为1的向量为标准。那么一个向量(3,2)实际是说在x轴投影为3而y轴的投影为2。注意投影是一个矢量,所以可以为负。

更正式的说,向量(x,y)实际上表示线性组合:

QQ截图20150402160825

不难证明所有二维向量都可以表示为这样的线性组合。此处(1,0)和(0,1)叫做二维空间中的一组基。

所以,要准确描述向量,首先要确定一组基,然后给出在基所在的各个直线上的投影值,就可以了。只不过我们经常省略第一步,而默认以(1,0)和(0,1)为基。

我们之所以默认选择(1,0)和(0,1)为基,当然是比较方便,因为它们分别是x和y轴正方向上的单位向量,因此就使得二维平面上点坐标和向量一一对应,非常方便。但实际上任何两个线性无关的二维向量都可以成为一组基,所谓线性无关在二维平面内可以直观认为是两个不在一条直线上的向量。

QQ截图20150402160901

另外这里要注意的是,我们列举的例子中基是正交的(即内积为0,或直观说相互垂直),但可以成为一组基的唯一要求就是线性无关,非正交的基也是可以的。不过因为正交基有较好的性质,所以一般使用的基都是正交的。

基变换的矩阵表示

下面我们找一种简便的方式来表示基变换。还是拿上面的例子,想一下,将(3,2)变换为新基上的坐标,就是用(3,2)与第一个基做内积运算,作为第一个新的坐标分量,然后用(3,2)与第二个基做内积运算,作为第二个新坐标的分量。实际上,我们可以用矩阵相乘的形式简洁的表示这个变换:

QQ截图20150402160931

太漂亮了!其中矩阵的两行分别为两个基,乘以原向量,其结果刚好为新基的坐标。可以稍微推广一下,如果我们有m个二维向量,只要将二维向量按列排成一个两行m列矩阵,然后用“基矩阵”乘以这个矩阵,就得到了所有这些向量在新基下的值。例如(1,1),(2,2),(3,3),想变换到刚才那组基上,则可以这样表示:

QQ截图20150402160938

于是一组向量的基变换被干净的表示为矩阵的相乘。

一般的,如果我们有M个N维向量,想将其变换为由R个N维向量表示的新空间中,那么首先将R个基按行组成矩阵A,然后将向量按列组成矩阵B,那么两矩阵的乘积AB就是变换结果,其中AB的第m列为A中第m列变换后的结果

数学表示为:

QQ截图20150402161028

特别要注意的是,这里R可以小于N,而R决定了变换后数据的维数。也就是说,我们可以将一N维数据变换到更低维度的空间中去,变换后的维度取决于基的数量。因此这种矩阵相乘的表示也可以表示降维变换。

最后,上述分析同时给矩阵相乘找到了一种物理解释:两个矩阵相乘的意义是将右边矩阵中的每一列列向量变换到左边矩阵中每一行行向量为基所表示的空间中去。更抽象的说,一个矩阵可以表示一种线性变换。很多同学在学线性代数时对矩阵相乘的方法感到奇怪,但是如果明白了矩阵相乘的物理意义,其合理性就一目了然了。

协方差矩阵及优化目标

上面我们讨论了选择不同的基可以对同样一组数据给出不同的表示,而且如果基的数量少于向量本身的维数,则可以达到降维的效果。但是我们还没有回答一个最最关键的问题:如何选择基才是最优的。或者说,如果我们有一组N维向量,现在要将其降到K维(K小于N),那么我们应该如何选择K个基才能最大程度保留原有的信息?

要完全数学化这个问题非常繁杂,这里我们用一种非形式化的直观方法来看这个问题。

为了避免过于抽象的讨论,我们仍以一个具体的例子展开。假设我们的数据由五条记录组成,将它们表示成矩阵形式:

QQ截图20150402161053

其中每一列为一条数据记录,而一行为一个字段。为了后续处理方便,我们首先将每个字段内所有值都减去字段均值,其结果是将每个字段都变为均值为0(这样做的道理和好处后面会看到)。

我们看上面的数据,第一个字段均值为2,第二个字段均值为3,所以变换后:

QQ截图20150402161059

我们可以看下五条数据在平面直角坐标系内的样子:

现在问题来了:如果我们必须使用一维来表示这些数据,又希望尽量保留原始的信息,你要如何选择?

通过上一节对基变换的讨论我们知道,这个问题实际上是要在二维平面中选择一个方向,将所有数据都投影到这个方向所在直线上,用投影值表示原始记录。这是一个实际的二维降到一维的问题。

那么如何选择这个方向(或者说基)才能尽量保留最多的原始信息呢?一种直观的看法是:希望投影后的投影值尽可能分散。

以上图为例,可以看出如果向x轴投影,那么最左边的两个点会重叠在一起,中间的两个点也会重叠在一起,于是本身四个各不相同的二维点投影后只剩下两个不同的值了,这是一种严重的信息丢失,同理,如果向y轴投影最上面的两个点和分布在x轴上的两个点也会重叠。所以看来x和y轴都不是最好的投影选择。我们直观目测,如果向通过第一象限和第三象限的斜线投影,则五个点在投影后还是可以区分的。

下面,我们用数学方法表述这个问题。

方差

上文说到,我们希望投影后投影值尽可能分散,而这种分散程度,可以用数学上的方差来表述。此处,一个字段的方差可以看做是每个元素与字段均值的差的平方和的均值,即:

QQ截图20150402161142

于是上面的问题被形式化表述为:寻找一个一维基,使得所有数据变换为这个基上的坐标表示后,方差值最大。

协方差

对于上面二维降成一维的问题来说,找到那个使得方差最大的方向就可以了。不过对于更高维,还有一个问题需要解决。考虑三维降到二维问题。与之前相同,首先我们希望找到一个方向使得投影后方差最大,这样就完成了第一个方向的选择,继而我们选择第二个投影方向。

如果我们还是单纯只选择方差最大的方向,很明显,这个方向与第一个方向应该是“几乎重合在一起”,显然这样的维度是没有用的,因此,应该有其他约束条件。从直观上说,让两个字段尽可能表示更多的原始信息,我们是不希望它们之间存在(线性)相关性的,因为相关性意味着两个字段不是完全独立,必然存在重复表示的信息。

数学上可以用两个字段的协方差表示其相关性,由于已经让每个字段均值为0,则:

QQ截图20150402161208

可以看到,在字段均值为0的情况下,两个字段的协方差简洁的表示为其内积除以元素数m。

当协方差为0时,表示两个字段完全独立。为了让协方差为0,我们选择第二个基时只能在与第一个基正交的方向上选择。因此最终选择的两个方向一定是正交的。

至此,我们得到了降维问题的优化目标:将一组N维向量降为K维(K大于0,小于N),其目标是选择K个单位(模为1)正交基,使得原始数据变换到这组基上后,各字段两两间协方差为0,而字段的方差则尽可能大(在正交的约束下,取最大的K个方差)

协方差矩阵

上面我们导出了优化目标,但是这个目标似乎不能直接作为操作指南(或者说算法),因为它只说要什么,但根本没有说怎么做。所以我们要继续在数学上研究计算方案。

我们看到,最终要达到的目的与字段内方差及字段间协方差有密切关系。因此我们希望能将两者统一表示,仔细观察发现,两者均可以表示为内积的形式,而内积又与矩阵相乘密切相关。于是我们来了灵感:

假设我们只有a和b两个字段,那么我们将它们按行组成矩阵X:

QQ截图20150402161232

协方差矩阵对角化

根据上述推导,我们发现要达到优化目前,等价于将协方差矩阵对角化:即除对角线外的其它元素化为0,并且在对角线上将元素按大小从上到下排列,这样我们就达到了优化目的。这样说可能还不是很明晰,我们进一步看下原矩阵与基变换后矩阵协方差矩阵的关系:

设原始数据矩阵X对应的协方差矩阵为C,而P是一组基按行组成的矩阵,设Y=PX,则Y为X对P做基变换后的数据。设Y的协方差矩阵为D,我们推导一下D与C的关系:

QQ截图20150402161300

现在事情很明白了!我们要找的P不是别的,而是能让原始协方差矩阵对角化的P。换句话说,优化目标变成了寻找一个矩阵P,满足PCPT是一个对角矩阵,并且对角元素按从大到小依次排列,那么P的前K行就是要寻找的基,用P的前K行组成的矩阵乘以X就使得X从N维降到了K维并满足上述优化条件

至此,我们离“发明”PCA还有仅一步之遥!

现在所有焦点都聚焦在了协方差矩阵对角化问题上,有时,我们真应该感谢数学家的先行,因为矩阵对角化在线性代数领域已经属于被玩烂了的东西,所以这在数学上根本不是问题。

由上文知道,协方差矩阵C是一个是对称矩阵,在线性代数上,实对称矩阵有一系列非常好的性质:

1)实对称矩阵不同特征值对应的特征向量必然正交。

2)设特征向量λ重数为r,则必然存在r个线性无关的特征向量对应于λ,因此可以将这r个特征向量单位正交化。

QQ截图20150402161330

至此我们完成了整个PCA的数学原理讨论。在下面的一节,我们将给出PCA的一个实例。

算法及实例

为了巩固上面的理论,我们在这一节给出一个具体的PCA实例。

PCA算法

总结一下PCA的算法步骤:

设有m条n维数据。

1)将原始数据按列组成n行m列矩阵X

2)将X的每一行(代表一个属性字段)进行零均值化,即减去这一行的均值

3)求出协方差矩阵QQ截图20150402161423

4)求出协方差矩阵的特征值及对应的特征向量

5)将特征向量按对应特征值大小从上到下按行排列成矩阵,取前k行组成矩阵P

6)Y=PX即为降维到k维后的数据

实例

这里以上文提到的

QQ截图20150402161059

为例,我们用PCA方法将这组二维数据其降到一维。

因为这个矩阵的每行已经是零均值,这里我们直接求协方差矩阵:

QQ截图20150402161521

然后求其特征值和特征向量,具体求解方法不再详述,可以参考相关资料。求解后特征值为:

QQ截图20150402161526

其对应的特征向量分别是:

QQ截图20150402161531

其中对应的特征向量分别是一个通解,c1c2可取任意实数。那么标准化后的特征向量为:

QQ截图20150402161538

因此我们的矩阵P是:

QQ截图20150402161543

可以验证协方差矩阵C的对角化:

QQ截图20150402161554

最后我们用P的第一行乘以数据矩阵,就得到了降维后的表示:

QQ截图20150402161601

降维投影结果如下图:

进一步讨论

根据上面对PCA的数学原理的解释,我们可以了解到一些PCA的能力和限制。PCA本质上是将方差最大的方向作为主要特征,并且在各个正交方向上将数据“离相关”,也就是让它们在不同正交方向上没有相关性。

因此,PCA也存在一些限制,例如它可以很好的解除线性相关,但是对于高阶相关性就没有办法了,对于存在高阶相关性的数据,可以考虑Kernel PCA,通过Kernel函数将非线性相关转为线性相关,关于这点就不展开讨论了。另外,PCA假设数据各主特征是分布在正交方向上,如果在非正交方向上存在几个方差较大的方向,PCA的效果就大打折扣了。

最后需要说明的是,PCA是一种无参数技术,也就是说面对同样的数据,如果不考虑清洗,谁来做结果都一样,没有主观参数的介入,所以PCA便于通用实现,但是本身无法个性化的优化。

希望这篇文章能帮助朋友们了解PCA的数学理论基础和实现原理,借此了解PCA的适用场景和限制,从而更好的使用这个算法。

Transport Geography

fieldstransp

————— the position of my field.   ————-from Haggett 2001.

Transport geography is a sub-discipline of geography concerned about the mobility of people, freight and information. It seeks to understand the spatial organization of mobility by considering its attributes and constraints as they relate to the origin, destination, extent, nature and purpose of movements.”

This is the book I found really useful during my PhD study, and I am still reading it some times.

The geography of transport systems

https://people.hofstra.edu/geotrans/eng/ch1en/conc1en/ch1c1en.html

I have been once asked a question about network analysis.  – Why do you think network is so important that you want to further develop the complex network analysis approach in your research?

A very disorganized answer was given…. then. Here I quote one sentence –

” since geography seeks to explain spatial relationships, transport networks are of specific interest because they are the main physical support of these interactions.”

Measuring variability of mobility patterns from multiday smart-card data

you can find the full paper here , free access to your article, and is valid for 50 days, until July 9, 2015. I chose a green pass publication.

Highlights of the paper

a framework for measuring variability based on level of details.
  •    of individuals
  •    of stations
  •    of areas
analytical methods for measuring variability at different levels.
 A case study of Singapore was conducted using one-week smart-card data.
Insights were made into the transit, social and urban dynamics in Singapore.

fourstopprofile_1

被遗忘的村庄,被遗忘的主题

早上来办公室看了一篇腾讯图话。 – 被遗落的村庄

“浙江舟山嵊泗嵊山岛后陀湾,这个海岛上的无人渔村因其独特的景观而走红。现在中国很多地方,出现了越来越多的无人村。过去人们日出而作、日落而息的田园生活已经慢慢淹没在喧嚣的城市城镇化进程中,人们背井离乡,投身更好的栖息地和淘金所。曾经与自然亲近的村落,成为遗落乡野的废弃景观。”

突然想起来今年中英合作的项目,看到基金委的网站上,列出的21份申请的题目,全都是关于低碳环保的课题。看来之前柴静的苍穹之下的确唤起了人们对环保和健康的关注。5个子课题里面,大家居然默契的选择了同一个,无一例外。那么另外四个人,其实就个人来说,我对人口流动的问题真的很感兴趣。中国城市的自组织结构是我第二感兴趣的课题。可惜没有机会去研究。希望以后还是机会吧。